
Many web applications, especially data-intensive apps, use charts and graphs to display data better. They enable us to analyze data and identify trends and patterns more effectively. Thanks to JavaScript, we can now add interactivity to charts and graphs. This interactivity greatly improves user interaction and experience. However, creating such charts and graphs requires lots of time and effort. Fortunately, we have JavaScript libraries for data visualization today. These libraries make it easier and quicker to integrate charts and graphs into web applications.
With these libraries, developers get pre-built components/functions to create customizable and interactive charts for their web apps. This way, developers don’t have to create charts manually, which requires a lot of time.
This article will discuss:
- The key features of five leading JavaScript libraries for data visualization.
- Factors to consider when selecting a JavaScript data visualization library.
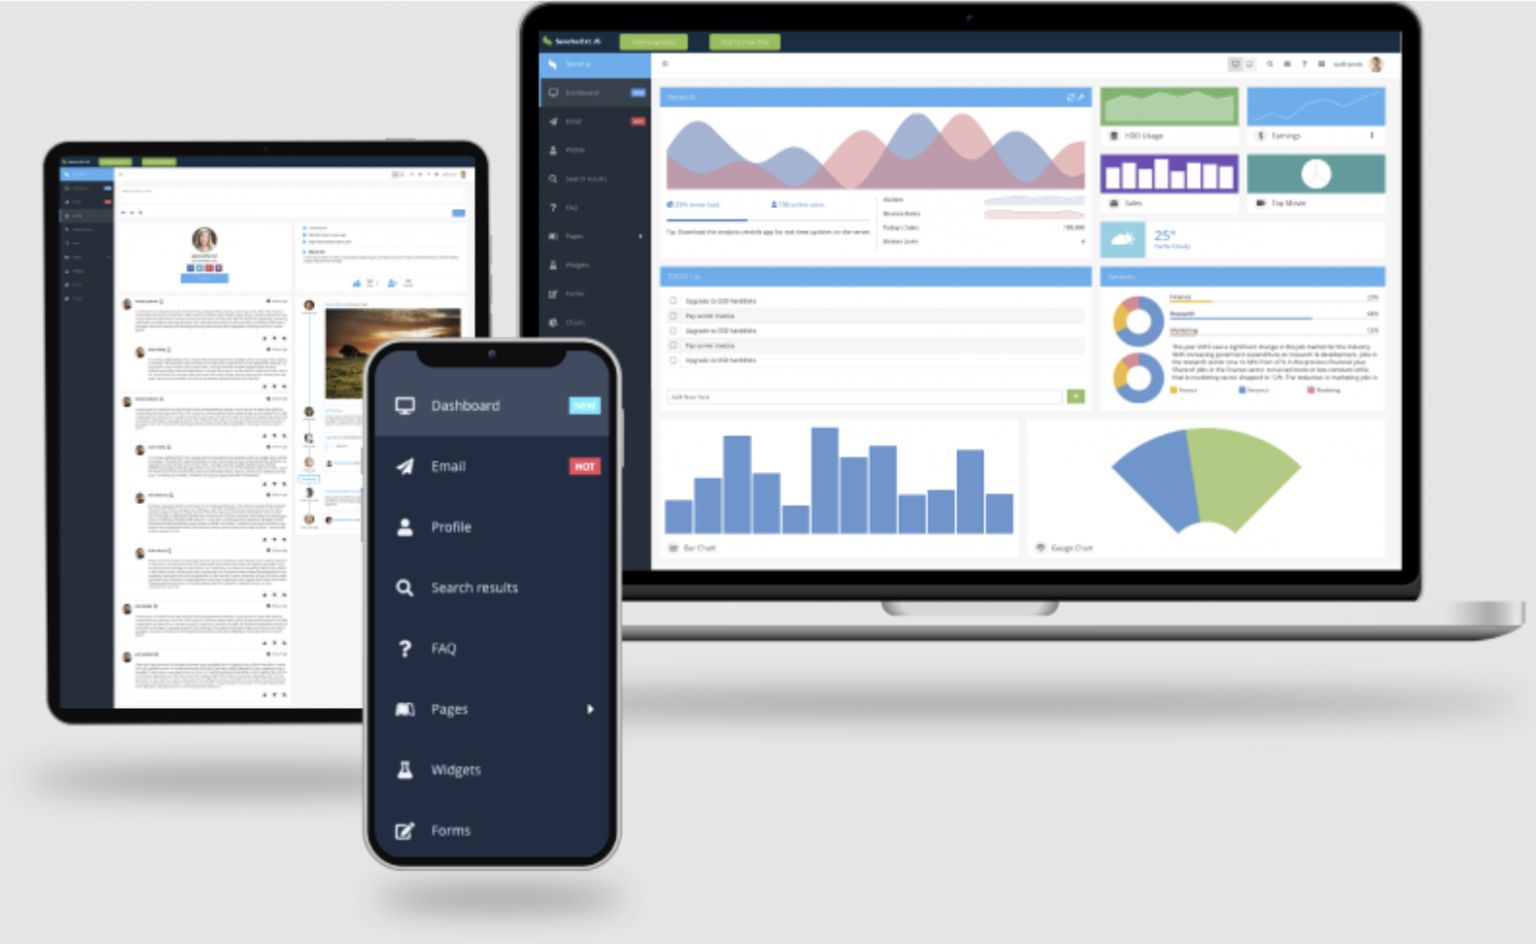
Ext.js
Ext JS is a JavaScript framework for creating high-performance web and mobile apps quickly.
Key features of Ext JS include:
- Provides 140+ pre-built and highly customizable UI components. These include buttons, icons, sliders, carousels, dropdown menus, a powerful JavaScript grid, and more.
- All Ext JS components are fully tested to work efficiently across browsers and devices.
- Supports both MVC and MVVM architectures
- Provides robust data-handling mechanisms with data stores, models, and proxies.
- Supports two-way data binding.
Ext JS also offers components and features for data visualization. Developers can utilize these to create visually appealing and interactive web-based charts, graphs, and dashboards. The framework also supports various D3 adapters.
Advanced Charting With Ext JS
Ext JS comes with a powerful chart package that provides data visualization functionality. It supports a wide range of basic and advanced charts and graphs, such as:
- Bar charts
- Stacked bar charts
- Column charts, pie charts
- Donut charts
- Double donut charts
- Line charts, area charts
- Gauge charts, and more.
The chart package essentially contains a hierarchy of classes for implementing legends and markers, such as axes, series, interactions, and mechanisms. These classes and components allow you to customize and style your charts and graphs the way you want. For instance, you can customize each series in a chart individually, customize axes, define the position, appearance, and layout of legends, and define colors, line styles, gradients, markers, etc.
Moreover, Ext JS offers a robust theming system, allowing you to customize your charts’ overall look and feel, such as fonts and colors. The framework includes multiple built-in themes that you can also modify to match your app’s design. You can create your own custom themes as well.
Developers can also utilize Ext.js to create highly interactive charts. Exr JS charts support various user interactions. These include touch events, mouse events, and gestures. Users can tap, click, or hover on elements to perform actions. Additionally, Ext.js provides built-in support for zooming and panning. Ext JS also allows developers to add animation effects to charts for a more engaging user experience.
Responsive and Scalable Visualizations
Ext JS enables developers to create responsive charts and graphs that can adapt to various screen sizes. Developers can define rules for the visibility and positioning of components, including charts based on device and screen size.
Moreover, developers can optimize Ext JS charts for performance using techniques like throttling and debouncing mechanisms for events, virtualization for rendering, lazy loading, etc.
D3.js
D3 (Data-Driven Components) is a JS library that developers can utilize to create interactive and dynamic data visualizations in web browsers.
Key features of D3 include:
- Open-source and easy-to-use charting library
- Uses SVG, CSS, and HTML to create visualizations.
- Allows developers to bind any type of data/arbitrary data to DOM (Document Object Model) and make it interactive by leveraging data-driven transformation.
- Highly flexible. For instance, with D3, you can create an HTML table from an array of numbers. You can also use the same data to create an interactive SVG column chart.
- Provides you with complete control over data selection.
Chart.js
Chart.js is another great JavaScript library for creating data visualizations for the web. Here are its key features:
- Open-source
- Easy-to-use HTML5-based library
- Supports all modern browsers.
- While the library currently supports eight chart types, it allows you to create attractive and interactive data visualizations.
- You can customize and style charts, such as colors, line segments, fonts, tooltips, legends, and more.
- You can mix and match chart types to compare datasets.
- Supports animated transitions and has a built-in responsive design.
- Charts built with the Chart.js automatically adjust according to the screen size. This depends on the defined dimensions of the container.
Highcharts
Highcharts is a well-known JavaScript charting library used by hundreds of companies and developers.
Key features of Highcharts include:
- Supports a wide range of charts. These include bar, column, pie, donut, and bubble charts and many more.
- Supports customizable charts. You can customize labels, colors, fonts, legends, tooltips, and more.
- Charts built with Highcharts are responsive by default. They automatically adjust according to various screen sizes as well as orientations.
- Supports interactivity
Plotly.js
Plotly is a simple JavaScript library for creating dynamic, data-driven visualizations for web apps.
Key features of the library include:
- Open-source and easy-to-use
- Built on top of d3.js and stack.gl
- Supports over 40 different types of charts, including 3D charts, statistical graphs, and SVG maps.
- Supports chart customization, animated transitions, and real-time charts.
Choosing the Right Library for Your Project
Assessing the following factors can help you choose the right Javascript library for your needs:
Supported Chart Types
Assessing whether the library offers all the chart types you want to integrate into your app is essential. You can also use multiple JS libraries for data visualization in one project, but make sure all the charts and graphs have a consistent visual appearance.
Style and Customization
Another crucial factor to consider is how much control the library provides over the style of your visualization. Assess whether you can customize fonts, colors, axes, legends, tooltips, etc.
Compatibility and Responsiveness
Before choosing a JavaScript charting library, evaluating its compatibility with browsers is crucial. For instance, some libraries don’t support older browsers. Moreover, you should also evaluate whether the library supports responsive charts that can adapt to various screen sizes.
Conclusion
A JavaScript library for data visualization provides pre-built components and functions. They allow developers to create customizable and interactive charts and graphs for their web apps. When choosing a JavaScript data visualization library, assess factors like supported chart types, compatibility with browsers, responsiveness, and available customization options.
FAQs
Can JavaScript be used for data visualization?
Yes, JavaScript allows you to create dynamic and highly interactive charts and graphs. You can also use a JavaScript library for data visualization to add high-performance charts to your web apps quickly.
Which library is most used for data visualization?
Some of the widely used JS libraries for data visualization include:
- Ext.js
- Highcharts
- D3.js
- Plotly.js
- Chart.js.
What are the four ways to display data in JavaScript?
Four common ways to display data in JavaScript include:
- console.log()
- window.alert()
- innerHTML
- document.write()

I’m Navin Sharma, a passionate Full Stack Developer with over 20 years of experience in the tech industry. Throughout my career, I’ve had the privilege of working on a variety of exciting projects, developing everything from dynamic web applications to complex back-end systems. My expertise spans both front-end and back-end technologies, and I thrive on building solutions that are not only functional but also scalable and user-friendly.
Beyond my hands-on development work, I’ve contributed to several well-respected tech and startup blogs, where I share my insights on the latest trends, development strategies, and best practices in the world of web development. I also have a strong background in app analysis, where I’ve helped companies optimize their products for better performance and enhanced user experience.
Whether I’m working on a challenging coding problem or mentoring fellow developers, I’m always eager to learn, innovate, and push the boundaries of what’s possible with technology.